Visualizing the protonet using Raphaël.js
By Protonet Team. Published 31. August 2010.
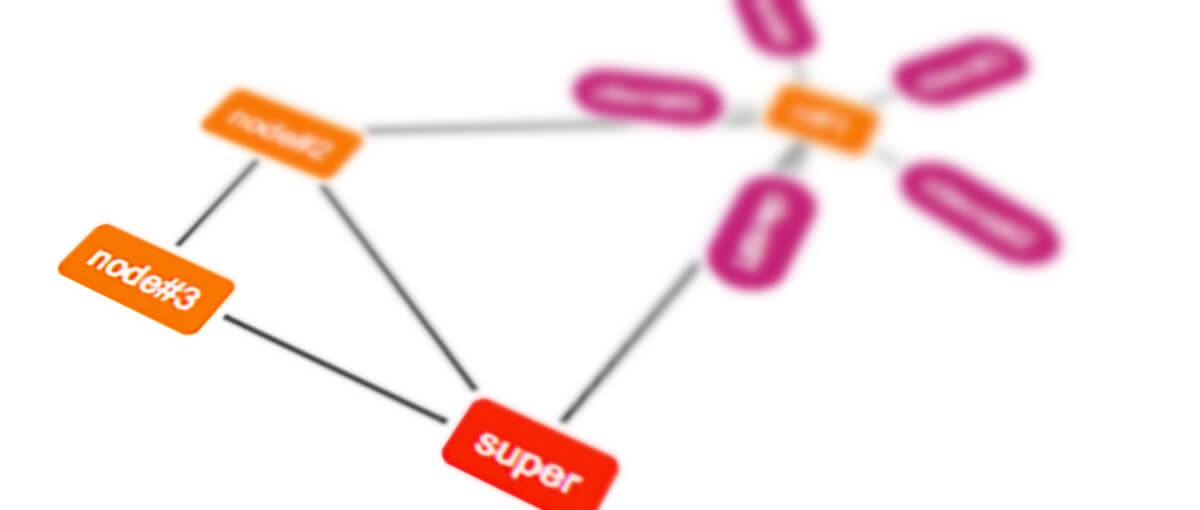
For protonet we needed a way to show the structure of the protonet to the user in a compact and visually pleasing way.
1. Interactive graphics on the Net.
There are a number of possibilities when it comes to dynamic graphics on the net, just to name a few:
- plain JavaScript (maybe with some DIV-tags flying around)
- HTML5 Canvas Tag
- Flash
- Java
- SVG
We chose SVG and on top of that there is the beautifully simple yet powerful Raphaël.js framework.
Let me summarize the advantages of SVG over the other options mentioned:
- can attach DOM events on any visual element
- anti-aliased rendering for free (see http://en.wikipedia.org/wiki/Aliasing)
- scaling of visuals has no effect on the quality (see http://en.wikipedia.org/wiki/Vector_graphics)
Sure, there are some disadvantages, but we will ignore them for now, because that is not exactly the topic of this post.
2. What kind of graph is a protonet?
A network is just a graph, but there are certain kinds of graphs. A protonet network structure can be very chaotic and random, so its most likely a general kind of graph. But when it comes to the part of the network where clients connect to their local protonet node, its a simple tree graph. This distinction is important, because the layout algorithms you choose directly depend on the type of graph you want to visualize.
3. What is a beautiful layout?
Suppose you have a group of nodes that are connected in a way that they form a kind of ring. The most structured way to display them would be to create a layout where the ring they form is clearly visible. So we have Simplicity (= make the structure visible) as the number one criterion for the beauty of a graph.
Simplicity comes from a number of more specific characteristics:
- edges should not cross each other
- edge lengths should all be approx. the same
- distances between nodes should all be approx. the same
The topic of graph layout is a wide one and cannot be covered in an appropriate way in this blog post, so if you are interested in graph visualization, go ahead to http://en.wikipedia.org/wiki/Information_visualization and also http://en.wikipedia.org/wiki/Graph_drawing
What does this mean for protonet?
For protonet we essentially need two distinct graph drawing algorithms because we have two different types of (sub)graphs:
- random graph = the connected protonet nodes
- and tree subgraph(s) = the clients connected to their protonet node
4. Force based approach.
What automaticly springs into mind when it comes to general graphs, is a physics/force-based layout. In such a modell the nodes are charged particles of the same charge, which means they move away from each other, and the edges are springs that create an opposite force which brings the connected nodes closer together. Here is a piece of pseudocode that draws such graph using physical forces:
– place the nodes at random positions
– iterate for about 50-100 times:
– calculate the attractive and repulsive forces
– apply the forces to each node
– draw the graph
The forces (as described here: http://en.wikipedia.org/wiki/Force based_algorithms_%28graph_drawing%29) are calculated using the equation of Coulomb for the charged particles and Hooke’s Law for the spring forces.
After a number of iterations (50-100) the graph should be displayed in a visually simple and ordered way.
This is, of course, a rather simplified version of the algorithm. To give you an idea of what is going on in reality, here is the actual code from the protonet network layout code base:
Graph.prototype.layout = function() {// determine amount of nodes (not clients!)
var normal_nodes = new Array();
for (var n = 0; n < this.nodes.length; n++) { var node = this.nodes[n]; if (node.info.type != ‘client’) normal_nodes.push(node); } // special case: one node if (normal_nodes.length == 1) { var node = normal_nodes[0]; node.position.x = this.w / 2; node.position.y = this.h / 2; this.layout_clients(); return true; } var delta_t = 1000.0 / 50.0; // starts 50 times within 1000 ms if (this.temperature > 0.0)
{
this.paper.clear();
// calculate repulsive forces
for (var n = 0; n < this.nodes.length; n++) {
var node = this.nodes[n];
node.disp = new Vertex(0, 0);
node.adjusted = false;
for (var m = 0; m < this.nodes.length; m++) {
var otherNode = this.nodes[m];
if (node.number != otherNode.number) {
var delta = node.position.diff( otherNode.position );
if (Math.floor(delta.len()) == 0) delta = new Vertex(1,1);
var d = delta.len();
node.disp =
node.disp.sum(
delta.quot(d).prod(
this.force_repulse(d * node.mass)
)
);
}
}
}
// calculate attractive forces
for (var e = 0; e < this.edges.length; e++) {
var edge = this.edges[e];
var u = edge.fromNode;
var v = edge.toNode;
var delta = v.position.diff(u.position);
if (Math.floor(delta.len()) == 0) delta = new Vertex(1,1);
var d = delta.len();
v.disp =
v.disp.diff(
delta.quot(d).prod(
this.force_attract(d)
)
);
u.disp =
u.disp.sum(
delta.quot(d).prod(
this.force_attract(d)
)
);
}
for (var n = 0; n < this.nodes.length; n++) {
var node = this.nodes[n];
if (node.info.type != ‘client’) {
node.position =
node.position.sum(
node.disp.quot(node.disp.len()).prod(
this.min(node.disp)
)
);
// don’t let them escape the canvas
if (node.position.x < 0) node.position.x = 0; if (node.position.x > this.w) node.position.x = this.w;
if (node.position.y < 0) node.position.y = 0; if (node.position.y > this.h) node.position.y = this.h;
}
}
this.layout_clients();
this.cool();
}
return true;
};
Among other things, there is a also a cooling function that slows down the motion in the graph and also ways of avoiding nodes beeing at the same position. If you have any questions about the code, feel free to ask here!
But what about the clients connected to the protonet node, that form tree subgraphs?
5. Circular approach.
Tree graphs can easily be layouted by placing them on a circle around the central protonet node and drawing the edges between them inside the circle. Thus no edges will overlap, since the clients are only connected to the node not to each other.
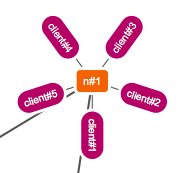
Simple, straight forward and faster as a force-based calculation.
If you want to experiment with layout techniques yourself, you can have a look into the complete code of the protonet graphkit package:
Graph.prototype.layout_clients = function() {
  // layout client nodes circular around each node
  for (var n = 0; n < this.nodes.length; n++) {
    var node = this.nodes[n];
    if (node.info.type != 'client') {
      // find client node connected to this one
      var clients = new Array();
      for (var e = 0; e < this.edges.length; e++) {
        var edge = this.edges[e];
        var u = edge.fromNode;
        var v = edge.toNode;
        if ((u.number == node.number && v.info.type == 'client') ||
            (v.number == node.number && u.info.type == 'client')) {
if (u.number == node.number)
clients.push(v);
else
clients.push(u);
}
}
// position clients circular around node
if (clients.length > 0) {
var radius = (this.small ? 5.0 : 10.0) + (clients.length * 5.0);
var angle = 360.0 / clients.length;
//console.log(angle);
for (var c = 0; c < clients.length; c++) { var client = clients[c]; client.info.angle = (c > Math.floor(clients.length / 2) ? 270 : 90) – angle * c;
client.position.x = node.position.x + Math.sin(deg_to_rad(angle * c)) * radius;
client.position.y = node.position.y + Math.cos(deg_to_rad(angle * c)) * radius;
client.info.nodepos = node.position;
}
}
}
}
};
6. Experiment with Graphkit.js
To draw a graph using the graphkit package, you have to include jQuery, raphael.js and graphkit.js (http://github.com/protonet/graphkit/blob/master/graphkit.js) into your webpage. Then you clone the Graph prototype and add nodes and edges to it.
Finally call the render() method once or install a JavaScript interval and watch the network adjust itself.
var NetworkGraph;
var ourInterval;
// make graph
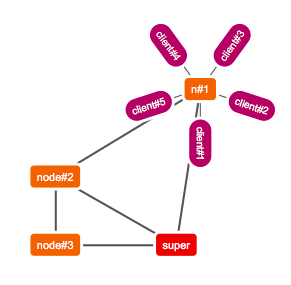
NetworkGraph = new Graph(“network”, 50, false);
// create some nodes
var sn = new Node(1, {name: “super”, type: “supernode”});
var n1 = new Node(2, {name: “n#1”, type: “node”});
var n2 = new Node(3, {name: “node#2”, type: “node”});
var n3 = new Node(4, {name: “node#3”, type: “node”});
var n4 = new Node(5, {name: “node#4”, type: “node”});
var n5 = new Node(6, {name: “node#5”, type: “node”});
var n6 = new Node(7, {name: “node#6”, type: “node”});
var c1 = new Node(8, {name: “client#1”, type: “client”});
var c2 = new Node(9, {name: “client#2”, type: “client”});
var c3 = new Node(10, {name: “client#3”, type: “client”});
var c4 = new Node(11, {name: “client#4”, type: “client”});
var c5 = new Node(12, {name: “client#5”, type: “client”});
NetworkGraph.addNode(sn);
NetworkGraph.addNode(n1);
NetworkGraph.addNode(n2);
NetworkGraph.addNode(n3);
NetworkGraph.addNode(c1);
NetworkGraph.addNode(c2);
NetworkGraph.addNode(c3);
NetworkGraph.addNode(c4);
NetworkGraph.addNode(c5);
// create some edges
NetworkGraph.addEdge(new Edge(sn, n1));
NetworkGraph.addEdge(new Edge(sn, n2));
NetworkGraph.addEdge(new Edge(sn, n3));
NetworkGraph.addEdge(new Edge(n1, n2));
NetworkGraph.addEdge(new Edge(n2, n3));
NetworkGraph.addEdge(new Edge(n1, c1));
NetworkGraph.addEdge(new Edge(n1, c2));
NetworkGraph.addEdge(new Edge(n1, c3));
NetworkGraph.addEdge(new Edge(n1, c4));
NetworkGraph.addEdge(new Edge(n1, c5));
ourInterval = setInterval(“NetworkGraph.render()”, 100);
The parameters of the Graph constructor are:
- The id of the HTML container to use for drawing.
- The maximum number of iterations (If the graph is considered “beautiful” the algorithm may stop before that).
- If a short or the normal version of the graph node should be drawn. In the short version clients are drawn without a label.
The algorithm is not perfect – You can download the source here and have fun with it 😉 – http://github.com/protonet/graphkit
Previous
Popular Read